Spring 2012
OCEAN BIOLOGY and biogeochemistry entered a new era in 1978 when NASA launched the Coastal Zone Color Scanner (CZCS) satellite. For the first time, a key measurement of marine ecosystems – maps of phytoplankton biomass, or chlorophyll – could be produced via space observations instead of spotty in situ sampling from the vast global ocean.
In time, other "ocean color" satellites were launched to provide a unique global perspective on the health of the ocean. The remotely sensed observations allow scientists, including those in EOS's Ocean Process Analysis Laboratory (OPAL), to track changes in the abundance and productivity of phytoplankton – the microscopic organisms that live in the ocean's surface waters and form the base of the marine food chain. This provides information on the ocean's essential functions and resources, and these ocean color "products" can be used to assess long-term climate changes, evaluate support of fisheries production, and detect harmful algal blooms, among other things.
 |
|
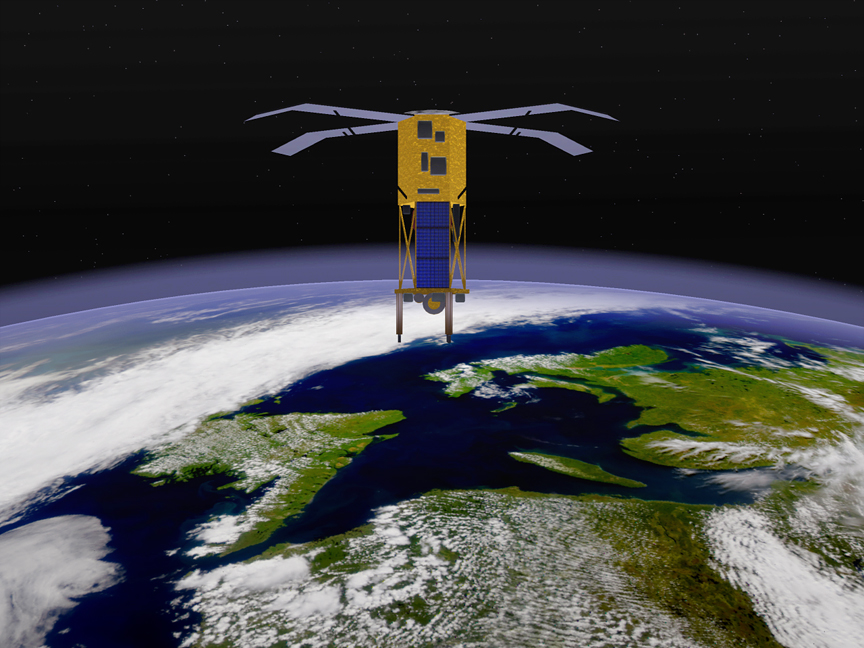
| Artist's conception of the now defunct SeaWiFS satellite, which was considered the gold standard for ocean-color remote sensing. Image courtesy of NASA. |
But 34 years after CZCS broke new ground, the U.S. is at risk of losing access to ocean color data and the long-term climate data records (CDRs) so essential to understanding and predicting climate change. This risk is due in large part to the demise of the 13-year-old Sea-viewing Wide Field-of-View Sensor (SeaWiFS) in 2010, the degradation of the Moderate Resolution Imaging Spectroradiometer (MODIS) onboard NASA's Terra satellite, and the fact that planned new satellite missions "might not be able to acquire data at the accuracy levels needed for climate research" according to a recent report by the National Academy of Sciences entitled "Assessing Requirements for Sustained Ocean Color Research and Operations."
Says OPAL research scientist Tim Moore, whose work involves evaluating and assigning uncertainties to ocean color products to improve their effectiveness, "The report spells out what we need to do to maintain climate data records, which is a real concern. It's important because the ocean is such a big place and we can't measure it everywhere with ships or buoys, so satellite records have become the prime source of information for the climate record."
|
||
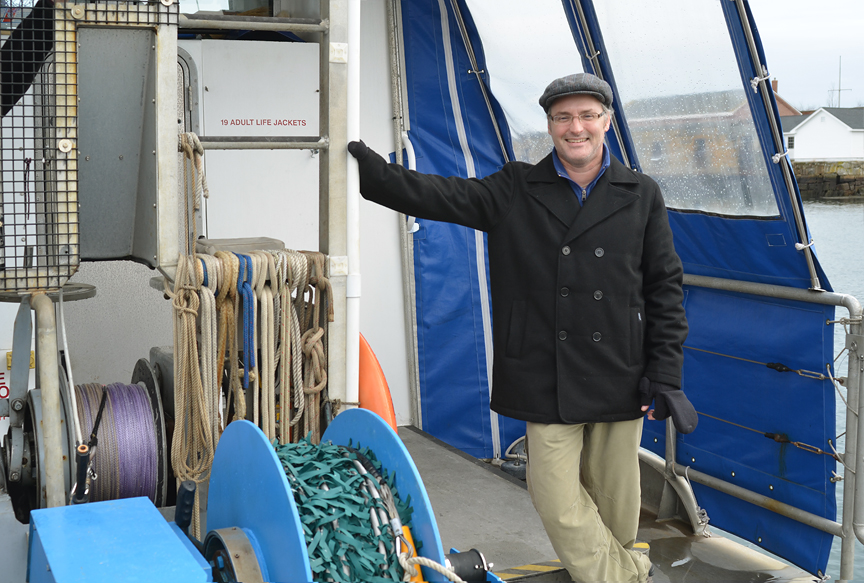
| Research scientist Tim Moore aboard the UNH Research Vessel Gulf Challenger. Photo by Kristi Donahue, UNH-EOS. | ||
Moore and OPAL research assistant professor Joe Salisbury both note that while the ocean color community is trying to make the best use of data currently being collected by the 10-year-old MODIS and the Visible Infrared Imaging Radiometer Suite (VIIRS) instrument on the National Polar-orbiting Operational Environmental Satellite System, it won't be until 2019 that the next advanced ocean color instrument on NASA's Pre-Aerosol-Clouds-Ecosystem (PACE) mission is launched.
"And this could mean a seven-year fumble or data gap in terms of the high-quality, continuous records needed for ocean color climate data records," Moore says.
A CDR is a time series of measurements of sufficient length, consistency, and continuity to determine climate variability and change. Salisbury notes that it has been asserted in specific papers that "if you have a data gap of a year or two your whole time series is compromised, it becomes a whole lot less meaningful."
For Moore and Salisbury, as well as OPAL research scientist Hui Feng, the CDRs are built on ocean color signals derived from phytoplankton (chlorophyll), particulate organic carbon, inorganic carbon, colored organic dissolved matter, etc. "that will have some sort of climate imprint on them," Moore says. "Ultimately, they're all variables that tell you about the biology of the oceans."
One size does not fit all
But those biological signals are buried in what the satellite sensor actually reads – the light field that is reflected off the ocean's surface. This reflected light or "spectral radiance" is the raw data from which scientists must pull out the specific information of interest – levels of chlorophyll, for instance.
The data of interest are extracted from the raw light field by applying various algorithms – procedures or formulas used for solving a particular problem. For example, Moore's work involves applying bio-optical algorithms to a group of large "provinces" he has broken the world's oceans into because, in essence, one size does not fit all.
 |
|
|---|---|
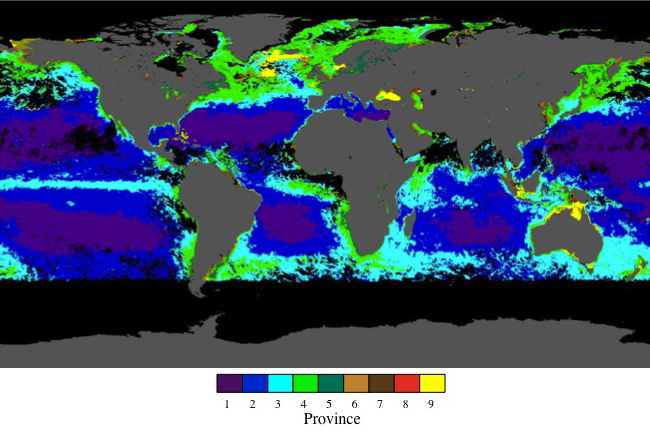
| This image shows Tim Moore's nine optical provinces as mapped from SeaWiFS for June 2004. Each color (province) represents an optical water type defined in terms of reflectance characteristics. Ocean gyres (purple) share similar 'optical' properties and are mapped to the same province. Transitions between provinces indicate changes in optical properties.
Image courtesy of TIm Moore, UNH-EOS. |
|
"I've split the world into nine bio-optical ocean provinces because, for these algorithms I work with, different ones work better in different environmental situations," Moore says. "Through this province approach you can tailor algorithms specific to each province."
Thus, one of Moore's jobs is to evaluate the ocean color products and assign uncertainties to them so ocean scientists can reliably gauge how accurate these satellite-derived physical/biological data are.
"There's a requirement for these climate records to have uncertainties associated with them so my research specifically deals with these uncertainties, the error bars of these ocean color products that are being generated from satellites," Moore says.
The bio-optical provinces Moore has created are not geographically specific but, rather, define specific water types found throughout the world's oceans. For example, ocean gyres – the large expanses in the middle of the oceans – can be distinguished from coastal waters, and different types of coastal water from each other. Using this approach, Moore can map properties of each province spatially and include the performance characteristics of bio-optical algorithms. "Thus, instead of getting just one performance number for the whole global ocean, I'm able to see how well different algorithms perform across different optical water types."
The complexity of pulling useful information out of the spectral radiance data is compounded by the fact that the ocean is a big moving target.
"You have to account for the dynamic behavior of the ocean and that's what these optical provinces are able to do, says Moore. "If you can identify different water types you can develop specific algorithms for each and reduce the uncertainty of the output."
Characterizing light underwater and from on high
And indeed, by taking in situ light field measurements of ocean waters from boats and buoys and comparing that with the light field "seen" by satellites, Moore has identified these specific water types.
"A lot of my work involves relating what is measured in the water optically to what the satellite is measuring and producing," Moore says.
Through regional and global match-up analysis of satellite products and in situ bio-optical products measured contemporaneously, Moore is able to gauge the accuracy of the ocean color products and provide a spatial map of that accuracy for each bio-optical province.
 |
|
|---|---|
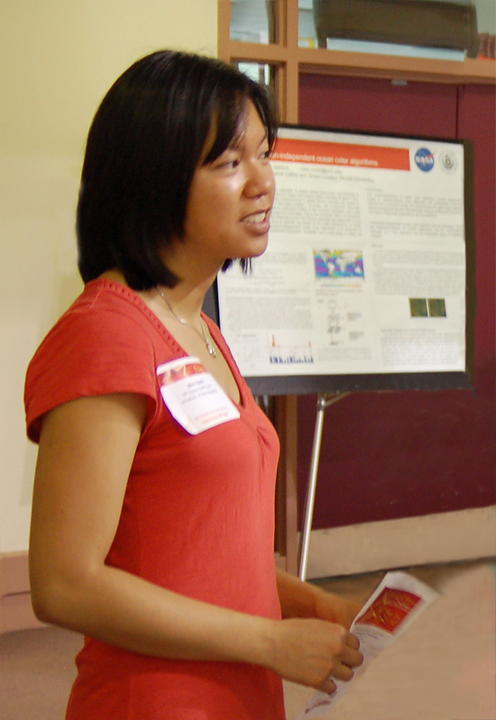
| Former OPAL Ph.D. student Mimi Szeto. Photo by Kristi Donahue, UNH-EOS. |
Former OPAL Ph.D. student Mimi Szeto conducted similar work for her dissertation when she analyzed chlorophyll concentration estimates provided by the now defunct SeaWiFS satellite, which is considered to be the gold standard for ocean color work, and saw a reduction in the typically large error bars when looking at different ocean basins rather than the full global ocean.
As detailed in a paper published in the Journal of Geophysical Research-Oceans on which she was lead author, Szeto compared the algorithm-derived chlorophyll concentrations against field samples and found chlorophyll concentrations were being seriously underestimated for the Pacific, Indian, and Southern oceans and overestimated for the Atlantic Ocean. Szeto and colleagues attributed the discrepancies between the satellite-based observations and the in situ measurements to systematic differences seen in different ocean basins' concentrations of colored detrital matter and in the light-absorbing properties of their differing phytoplankton communities.
Moore notes that Szeto et al's findings will play into his bio-optical algorithm/province work over the next two to three years.
Such work has importance beyond just a specific ocean color product in that the more accurate that product, the more accurately it can be used to assess related physical and biological activities. For example, interpretations of chlorophyll concentration estimates have been used, with varying degrees of success, for estimating the ocean's salinity and temperature, gas fluxes, nutrient availability, and the overall level of biosphere activity.
Says Moore, "So all of this, the potential lack of CDR ocean color data and a potential many year gap in the record before PACE launches, has implications on the ability to accurately run biogeochemical ocean models. Which gets back to what I do, I provide modelers with errors bars so they know how accurate the data is going into their models."
The entire thrust of the NAS "Assessing Requirements for Sustained Ocean Color Research and Operations" report, Moore notes, is assessing the potential gap in crucial climate data record and, "if it's clear that's going to happen, then determining what can we do to mitigate it."