
Winter 2011
LAST WINTER, the time-lapse cameras Mark Fahnestock and colleagues deploy year-round at the Jakobshavn Isbrae glacier captured a surprising nighttime image near its terminus – lights from fishing boats bobbing about in the fjord’s icy waters.
That fishing boats are able to get well into the fjord in winter is a recent historical first but is perhaps not so surprising in light of other firsts that occurred in the 2009-10 season: there was no wintertime advance of the glacier itself as it uncharacteristically shed, or "calved" icebergs all year long; Disko Bay, which feeds Jakobshavn’s fjord, was almost completely free of sea ice, and conditions in the fjord itself were unusual.
Notes Fahnestock, “The ice cover in the inner fjord didn’t stay stiff. It was unconsolidated, and so as it comes apart the ice moves and instead of shutting down calving for most of the winter as is normal the glacier keeps calving icebergs.”
To get a better handle on what might be fueling these changes, master’s student Ryan Cassotto and Fahnestock are compiling a decade’s worth of sea surface temperature records from NASA’s Moderate Resolution Imaging Spectroradiometer (MODIS) aboard the Terra satellite. From this they will derive the first comprehensive record of daily changes in fjord ice surface temperatures and conditions.
For his thesis work, Cassotto, whose background is in electromagnetic compatibility engineering and remote sensing, has taken ten years of MODIS thermal imagery for the larger Disko Bay region and remapped it at a one-kilometer resolution to see specifically and in greater detail what has been occurring in the fjord itself. He can then compare the thermal record with both seismic records and time-lapse imagery over the same period to better ascertain how changes in the fjord are affecting what the glacier itself is doing far inland.
 |
|
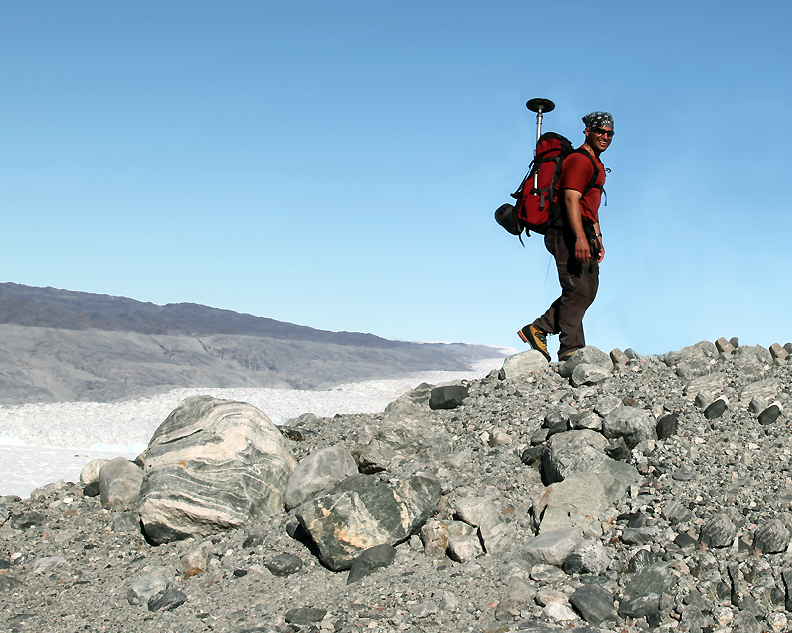
| Ryan Cassotto conducts a GPS survey to profile a lateral moraine above the researcher’s camp at Kangiata Nunata Sermia. The moraine (debris in foreground) represents the maximum extent of the last major glacial advance during the Little Ice Age.Photo by Mark Fahnestock. |
“I should be able to verify that the fjord is really mobile during these periods where we have calving in conjunction with these warmer water temperatures,” Cassotto says. Adds Fahnestock, “We’re just beginning to develop a picture of some of the ocean controls on the glacier that are not as simple as melting at its front.”
But, of course, rarely in so large and complex a system as an ice sheet are there one-size-fits-all answers, and Fahnestock notes that even in the same fjord system glaciers can be surprisingly out of sync with respect to changing environmental conditions.
In a fjord near Greenland’s capital of Nuuk, Fahnestock and company are looking at two distinctly different glaciers –one that has maintained itself since the Little Ice Age (a period of cooling that began around 1250 A.D. with the coldest periods during the 16th and 17th centuries) and is only now starting to thin while another neighboring glacier has been in retreat for some time.
“So now you’ve got the question of why would glaciers in different parts of the same fjord not respond synchronously. It’s a really interesting question, and we have some theories.”
FIVE FIELD SEASONS ago at the Jakobshavn Isbrae glacier in western Greenland, glaciologist Mark Fahnestock of the Complex Systems Research Center was “simply” trying to measure the speed with which the vast river of ice was racing towards the sea. Jakobshavn had doubled its pace in five years and scientists didn’t know why.
So Fahnestock and colleagues made two annual, month-long pilgrimages to Jakobshavn where they deployed Global Positioning System (GPS) receivers that rode Jakobshavn six months at a time as the behemoth gave new meaning to the saying “moving at a glacial pace.”
 |
||
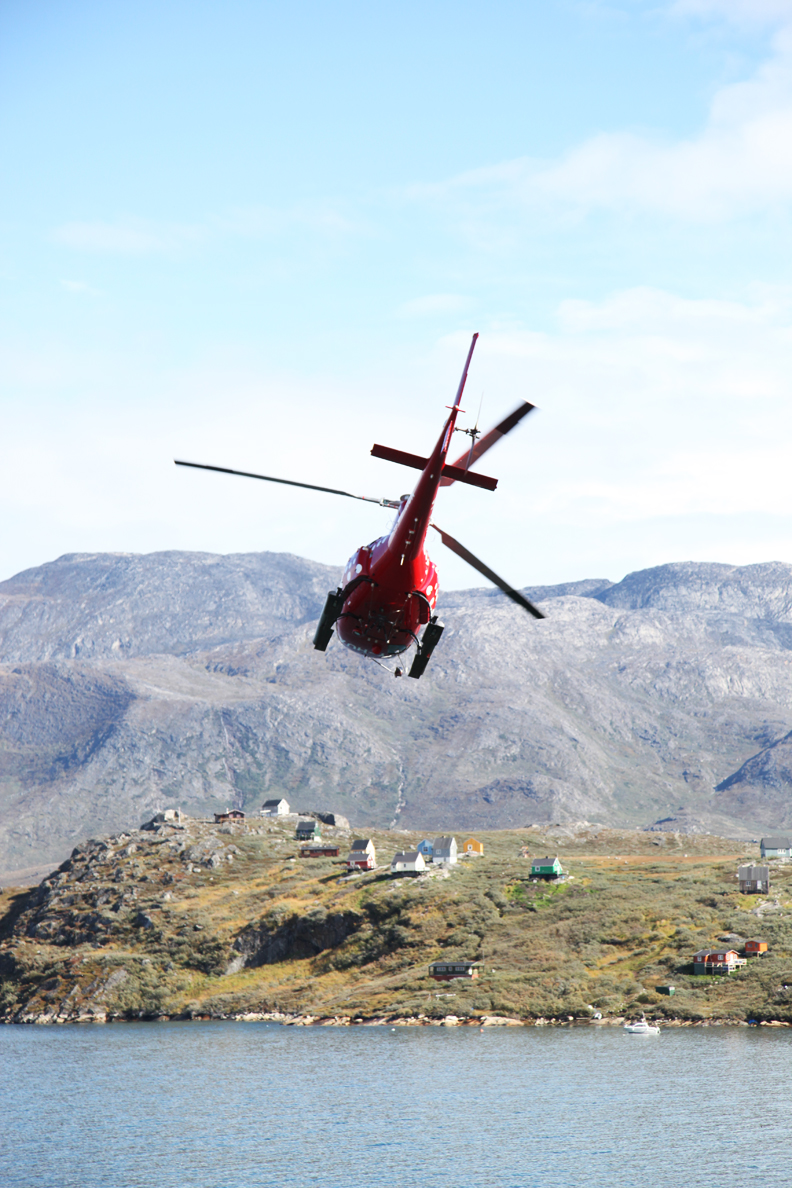
| A helicopter ride from the town of Kapisillit in Southwest Greenland takes researchers and supplies into their camp next to the glacier Kangiata Nunata Sermia. Photo by Mark Fahnestock. |
Since then, the researchers have had to move camp more than a kilometer “upstream” to keep near the terminus as the glacier backed up and disappeared around the corner.
Today, it requires a much bigger toolbox and a lot more scientists to adequately investigate the extent of what’s happening on the 100,000-year-old ice sheet – a process Fahnestock, exaggerating for clarity, calls “learning how to watch an ice sheet come apart.”
The greening of Greenland may be disconcerting in most respects, but these are indeed interesting times to be a glaciologist.
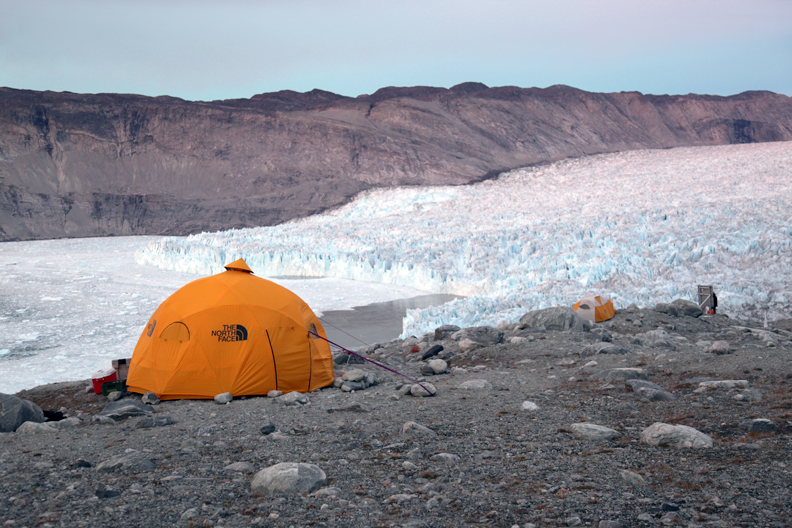 |
| Home for three weeks while studying Kangiata Nunata Sermia. The glacier was 1,600 feet thicker and filled this fjord to the line visible at the top of the ridge 200 years ago. Photo by Mark Fahnestock. |
“Six years ago we knew Jakobshavn’s speed had changed but we had just begun to grapple with trying to understand why. We’ve made progress with that problem but at this point the ice sheet is changing so much and so fast that we’re having a hard time keeping up. There are a lot of interesting problems to consider,” Fahnestock says.
Fortunately, in the last 15 to 20 years the tools and techniques that can now be applied to investigating a big, changing system like an ice sheet have evolved in scope and sophistication to help scientists wrestle with those problems. Indeed, back in the early 1990s it was a challenge to compile even a rudimentary map of the ice sheet’s basic features and flow rates to assist scientists in keeping a languid eye on a more-or-less steadfast system. Glaciology back then was the study of ice on Earth as it was at the time – known to change over thousands and hundreds of years but not on an annual basis.
Now, with scores of scientists scrambling to understand what’s driving big changes on a variety fronts, an array of instruments are being deployed year-round. Time-lapse cameras, seismometers, GPS receivers, radar, satellites and aircraft armed with lasers, and even old steel-hulled boats capable of navigating fjords choked with icebergs in an effort to probe the increasingly important ocean-side of the equation.
Says Fahnestock, “The urgency for getting better at measuring what the ice sheet is up to has come from watching it change over so short a period. In the last fifteen to twenty years the field of glaciology has gone from trying to understand why a glacier flowed the way it did to now trying to understand why the whole system is changing and how vulnerable it is to continued acceleration in a warmer climate. We need to do this to understand what the flow of the ice out of the ice sheet will look like in the future, which is ultimately driven by our need to know as best as we can just how much sea level rise is possible.”
An Ocean of Change
Scientists now know the ocean itself is having a profound influence on the changing glaciers in Greenland – in particular, tidewater outlet glaciers like Jakobshavn that terminate in fjords, and so they are looking more closely at the ice sheet in its ocean setting.
They’ve discovered that rapid changes in the glaciers themselves very quickly follow changing conditions in the fjords, including a lowering in sea ice cover and warmer water off the coast – the latter which is being measured by oceanographers who are seeing pulses of warm water entering the fjords from the open ocean.
“What you want to do then is connect that warming water to increased rates of flow from the ice sheet, which has several possible mechanisms behind it,” Fahnestock says. But getting at those mechanisms requires looking at a variety of phenomena simultaneously, which can be difficult.
For example, to understand how much energy from the warming water in the fjord ends up melting ice at the front of the glacier, measurements need to be made in an area that is typically choked with ice and enormous icebergs that have ripped away from the glacier – a process known as "calving" – and that produce equally enormous waves. Notes Fahnestock, “It’s a really tough place to make any observations, it’s difficult to access, and dangerous.”
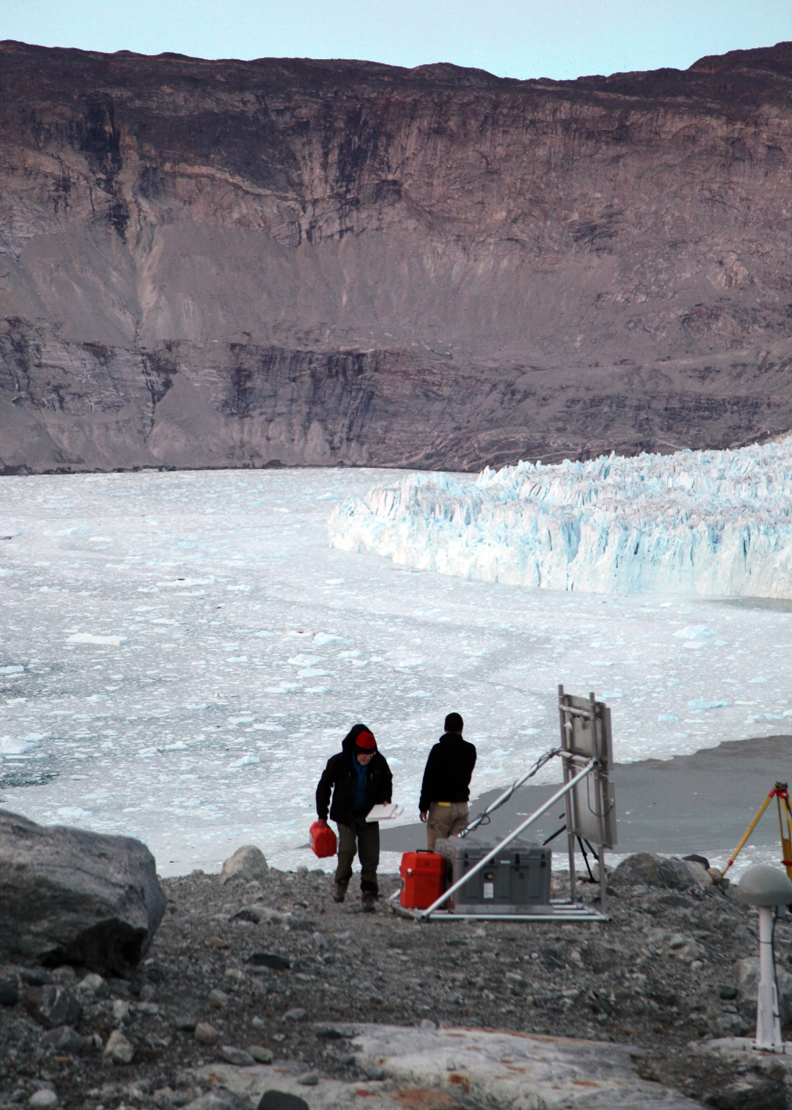 | |
| Two collaborators from the University of Alaska Fairbanks at the terminus of the glacier. Also pictured are a solar panel and battery bank that power year-round GPS observations, used by the researchers to measure uplift of the area in response to the loss of ice. Photo by Mark Fahnestock. |
Dangerous indeed. In 2009, Fahnestock and colleagues were lucky enough to catch the calving of an iceberg at Jakobshavn on film. A kilometer distant from the video camera, the berg that breaks off the front of the glacier and cascades into the rubble of ice in the fjord is so large that its disintegration and end-over-end rollover appears to happen in slow motion.
Another way to look at Jakobshavn’s ice output is like this: the glacier calves roughly 40 gigatons (40 billion metric tons) of ice per year. The CSX rail freight company claims to move a million tons of freight per day, which means it would take them roughly 1,000 days to move the icebergs from a typical (not large) calving event from this glacier and a century to move the ice Jakobshavn puts in the ocean in one year.
With numbers like that from one, albeit large, glacier on a planet with a rising thermostat, it’s fairly easy to envision waves lapping ever higher at the world’s coastlines.
Currently, if the melting of all the Greenland glaciers, those in the Canadian ice caps, Alaska, and some from Norway is added together it represents roughly a third of the present rate of sea level rise, which is about a foot per century.
But notes Fahnestock, “If you take the present rate as a foot in a hundred years, based on what we know from the last decade or decades, and project that forward given what we know about changes occurring now, I don’t think a meter (3.2 feet) over 100 years can be taken off the table yet. It's hard to imagine the rate staying as low as one foot.” He adds, “The Antarctic is not heavily involved in putting ice in the ocean right now, in a warmer climate it almost certainly will be.”